Sitemap
The Sitemap interface allows you to visualize the structure of any website that is proxied through Caido.
It keeps track of domains, folders, and requests, as well as any variations in query parameters and POST bodies. The Sitemap page provides a clear, hierarchical view of the website's structure, making it easy to identify and explore different parts of the site.
The Sitemap displays a tree-like structure, with the root node representing the root domain of the website. Each branch of the tree represents a subdomain or subfolder, and the leaves of the tree represent individual requests. You can click on any node to expand or collapse it, revealing or hiding its child nodes.
Sitemap Layout
To familiarize yourself with the Sitemap interface, continue below:
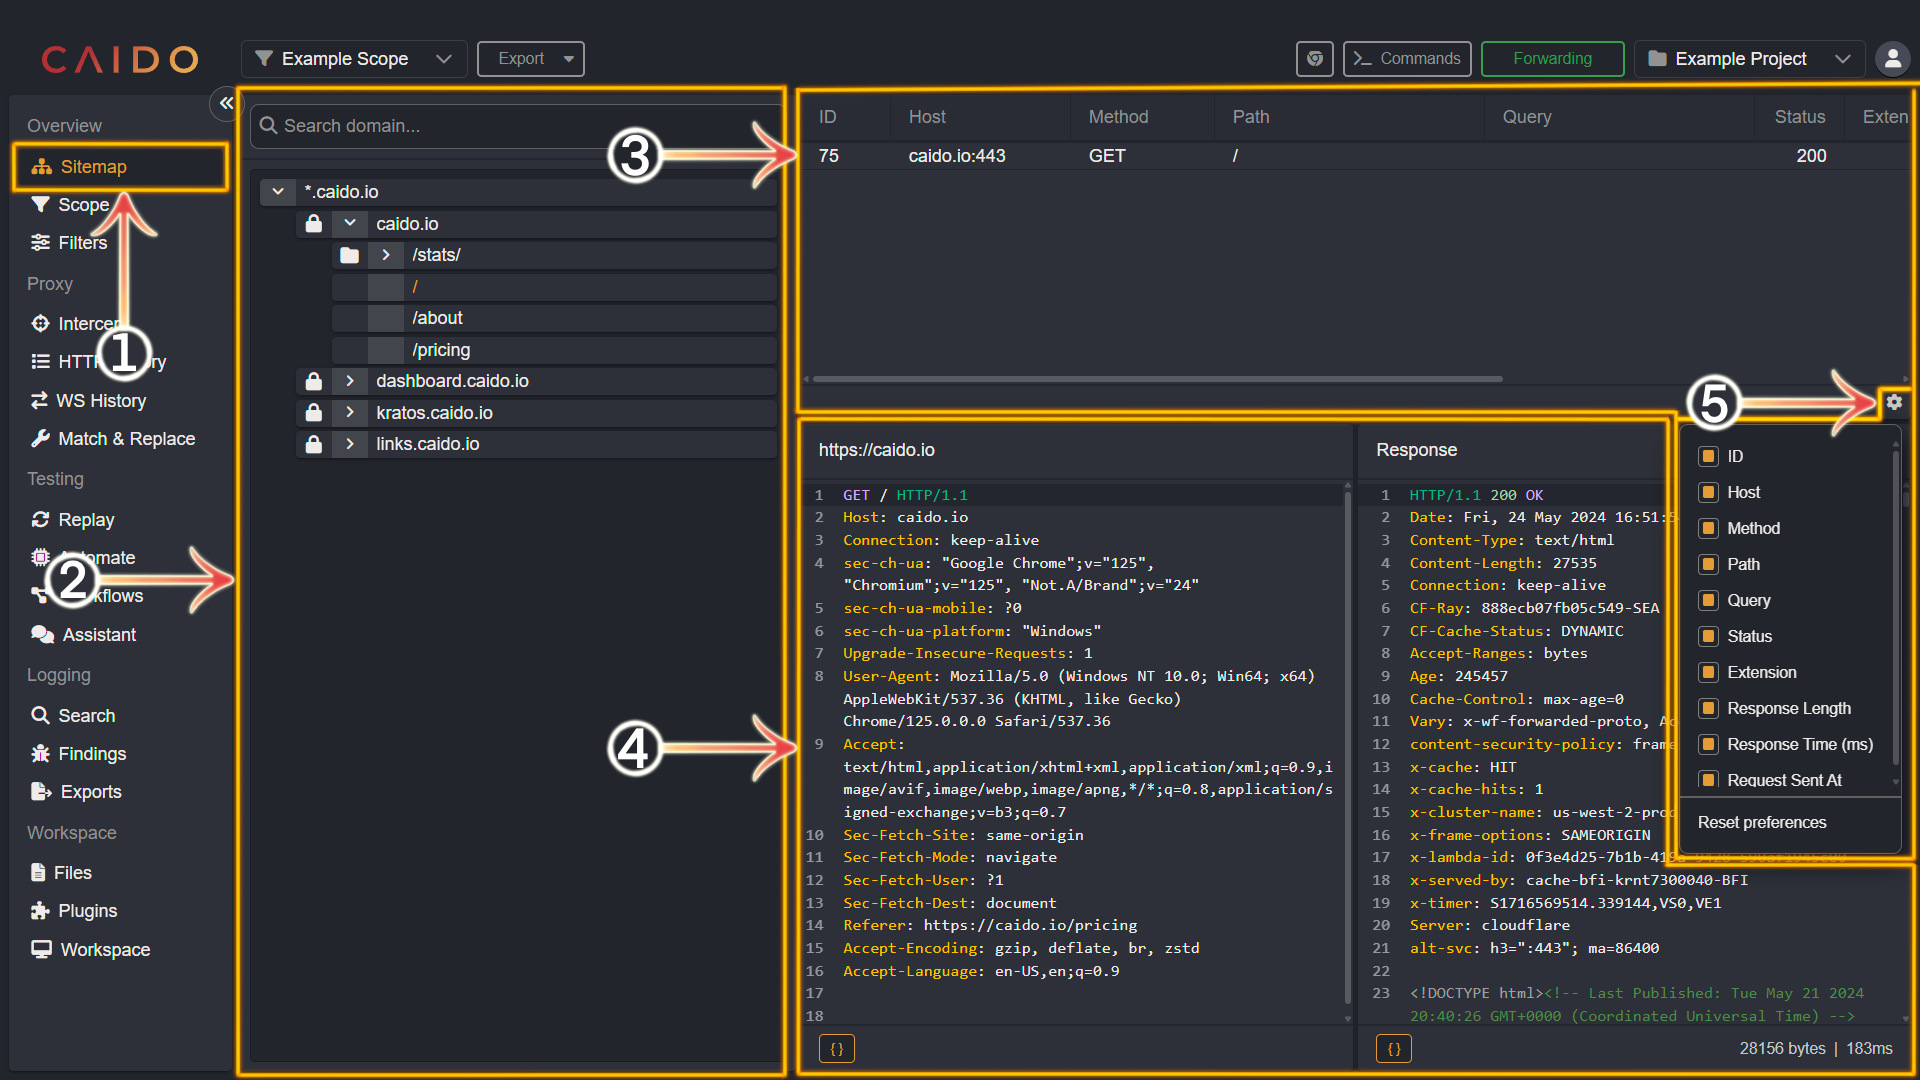
- Select the
Sitemaptab from the left-hand menu within the Caido window. - This pane presents the domains that have been proxied through Caido. Toggling the
>icon to∨will expand the associated domain/folder, revealing its contents. You can search for a specific domain/subdomain by utilizing theSearch domain...bar. - Upon selecting a node of the tree-like structure within the previously mentioned pane - all associated requests are displayed in this pane. Clicking the column names (located at the top and spanning horizontally) within this pane will sort the requests by the selected column category.
- The request and paired response panes are available here. At the bottom-right corner of the response pane, the response size (in bytes) and how long the response took to receive (in milliseconds) is provided.
- Clicking the cog wheel icon will present a dropdown menu that lists the aforementioned column categories. Select/deselect to include/exclude them respectively.
Additional Information
INFO
The padlock icon represents connections via HTTPS.
TIPS
- Clicking
Exportwill present you with options to export HTTP History data. View the Exports documentation for more information. - Applying a Scope Preset is supported by Sitemap.
- Clicking the column names (located at the top and spanning horizontally) within the top request list pane will sort the requests by the selected column category. View the Sorting by Properties documentation for more information.
- Clicking the
{}button will toggle the Pretty/Raw display option. - If you have installed the rendering engine - clicking the image icon located at the top-right corner of the response pane (not pictured above) will present a visual representation of the response. View the Basic Configuration documentation for more information.